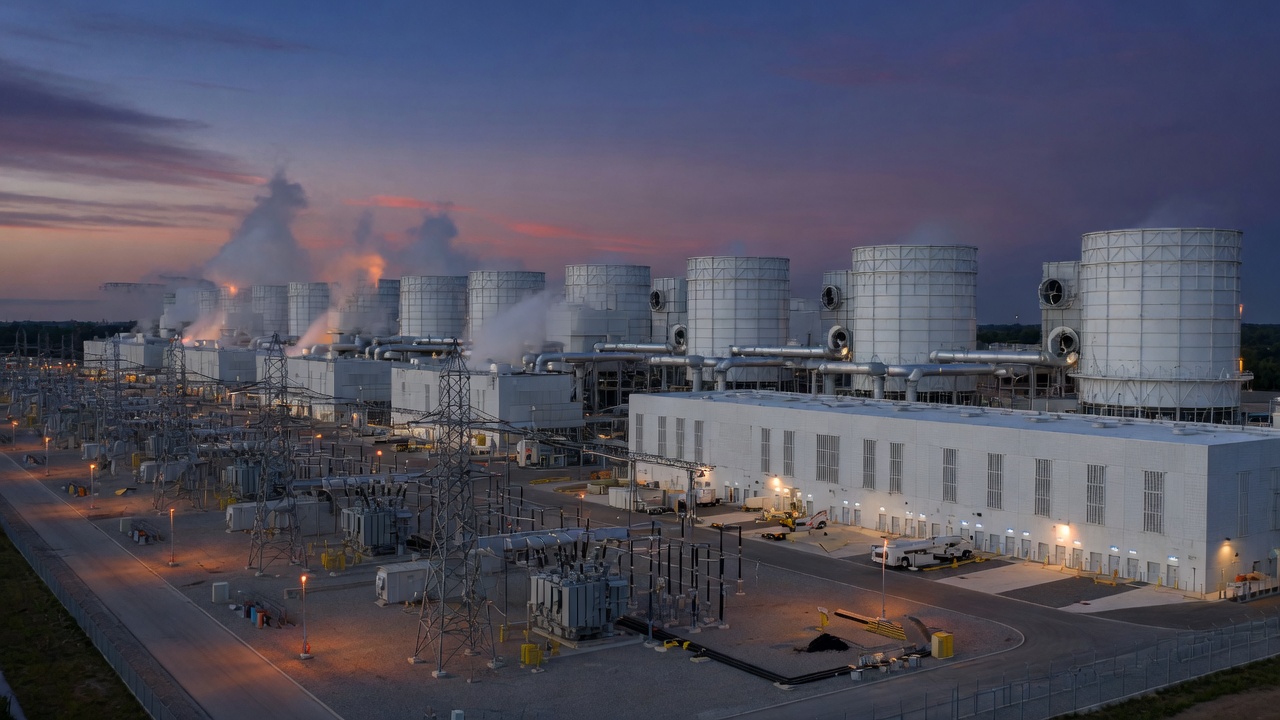
The gap between what Big Tech is spending on AI infrastructure and what AI is actually generating in revenue is no longer a rounding error — it’s a multi-hundred-billion-dollar chasm, and it’s widening even as the argument shifts from ‘is this a bubble’ to ‘how long can this run.’ The Economist puts 2025 US infrastructure spend at roughly $450bn, doubling to about $900bn in 2026. Goldman Sachs’ hyperscaler capex consensus has climbed from $465bn to $527bn for 2026 mid-earnings-season alone. Meanwhile, one widely cited estimate of the global ex-China generative AI economy sits at just $175bn annualized. This is the story LLM Watch will be tracking every month: not whether AI capex is big, but whether revenue is closing the distance fast enough to matter.
Why it matters
AI capex vs revenue has become the single most important variable for anyone building on, investing in, or selling into the AI stack. If the infra buildout outruns monetization for too long, expect tighter GPU allocation, pricier cloud compute, and consolidation among AI-native startups that can’t offset their own cloud GPU economics. If revenue catches up, the current spend looks like early-internet fiber-optic overbuild — expensive now, foundational later. Either way, the gap itself is now a leading indicator worth watching like a leaderboard, not a one-off headline.
The numbers, tracked
| Metric | Figure | Source |
|---|---|---|
| 2025 US tech infra spend | ~$450bn | The Economist |
| 2026 projected US tech infra spend | ~$900bn | The Economist |
| 2026 hyperscaler capex consensus (revised up from $465bn) | $527bn | Goldman Sachs |
| Cited annual capex-vs-AI-revenue deficit | $600bn+ | Industry estimate |
| Annualized global ex-China GenAI revenue | $175bn | Recent market coverage |
| 2025 debt raised to finance AI buildout | $400bn+ | The Economist |
Depending on which analyst’s model you use, the 2026 hyperscaler capex range spans from about $527bn (Goldman’s narrower hyperscaler-only figure) to roughly $775bn to $900bn (broader infrastructure figures including power, chips, and data centers, per The Economist and other estimates). That spread alone tells you the market hasn’t settled on a single denominator — which makes any single “bubble” headline less useful than a running comparison.
Key developments this cycle
- Consensus keeps drifting higher, not lower. Goldman Sachs notes 2026 capex estimates have moved up repeatedly through earnings season — a sign Wall Street is still catching up to real spending plans rather than the reverse.
- Debt financing is now a material share of the buildout. The Economist reports over $400bn in borrowing this year to fund infrastructure, a shift from the equity-funded capex of 2023–2024.
- Framing has moved from “startup hype” to “utility-scale economics.” Analysts increasingly compare AI infra spend to power-grid or telecom build cycles — a framing that changes the relevant time horizon from quarters to years.
- Revenue-tracking dashboards are proliferating. As capex figures get more scrutiny, so do GenAI revenue trackers, though methodologies vary widely (subscription revenue, API/token revenue, and enterprise contracts are counted inconsistently across sources).
The honest counter-argument
Bears point to the raw ratio: $900bn in spend against $175bn in revenue is roughly 5:1, a multiple that would be alarming in almost any other industrial capex cycle. But the counter-argument, made by some bulls, is that comparing full-year infra spend to current-year revenue misreads asset lifespans — GPUs and data centers are depreciated over 5-7 years, and revenue from a chip installed in Q4 2026 won’t show up meaningfully until 2027-2028. The honest read is that neither framing alone settles the debate; the deficit is real, but so is the lag between capacity coming online and demand catching up.
What it means for builders
For teams shipping AI products, this isn’t abstract macro noise. Cloud GPU economics set the marginal cost of every inference call, and hyperscaler capex decisions directly shape GPU availability and pricing 12-18 months out. If capex growth outpaces demand, expect continued price competition on inference (good for margins short-term); if hyperscalers start pulling back capex guidance — watch Q1 2026 earnings calls closely — expect tighter allocation and renewed urgency around model efficiency, quantization, and multi-cloud GPU sourcing. This is a living tracker: LLM Watch will update these figures as Q4 2025 and Q1 2026 earnings roll in, alongside any capex litigation trackers or disclosure disputes that emerge around infrastructure accounting.