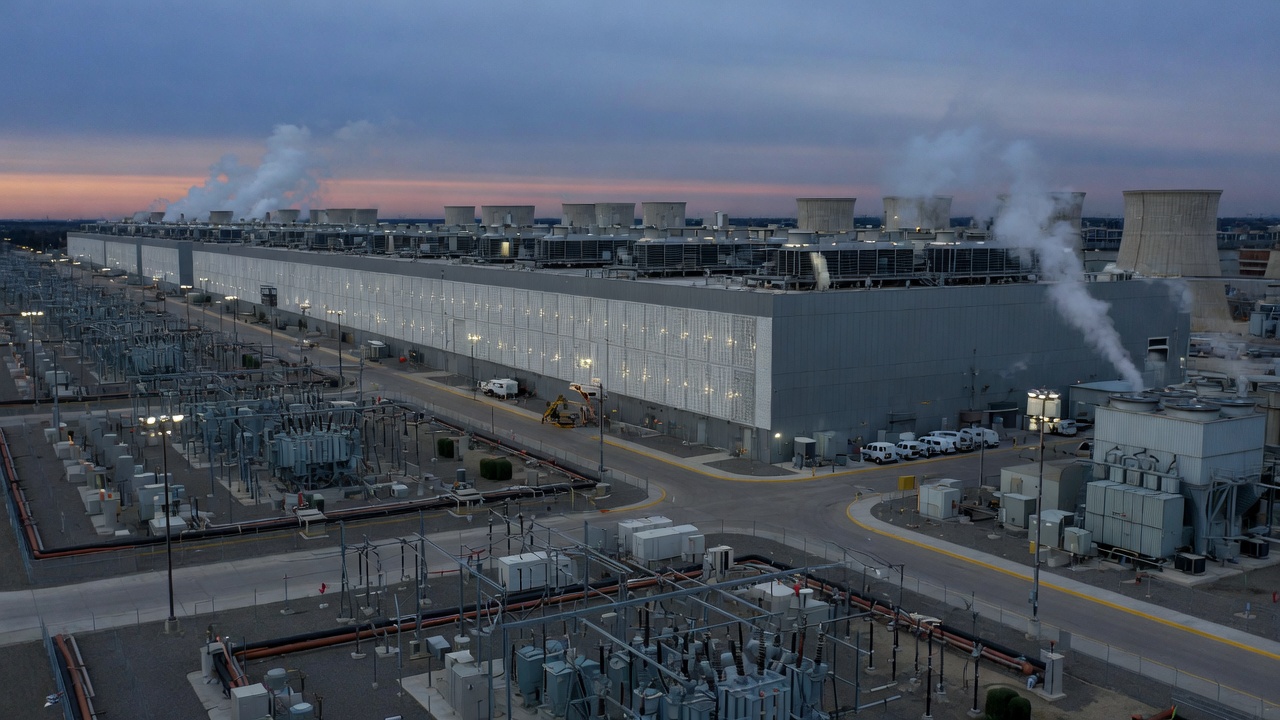
The AI industry is now spending faster than it can prove it out. U.S. data center construction spending climbed to an annualized pace above $75 billion in July, according to Axios, while PwC projects global data-center capex will hit roughly $800 billion in 2026 — and keep climbing toward a cumulative $31.6 trillion by 2050. Set against that: market estimates put the current annual AI revenue gap at around $600 billion, meaning infrastructure spend is running well ahead of what AI products are actually generating.
Why it matters
This is the number that will define AI markets coverage for the next several quarters: not which model tops a leaderboard, but whether hyperscaler infra spend and cloud GPU economics can be justified by revenue. Every earnings call from Microsoft, Google, Amazon, and Meta now gets read through this lens. If the gap keeps widening, expect sharper investor scrutiny of AI capex, tighter GPU utilization reporting, and pressure on cloud providers to show usage-based revenue, not just committed spend.
The numbers, tracked
- $75B+ — annualized pace of U.S. data center construction spending in July (Axios).
- $800B — PwC’s projected global annual data-center capex for 2026.
- $31.6T — PwC’s cumulative global AI infrastructure investment forecast through 2050.
- ~$600B — widely cited estimate of the annual gap between AI revenue and hyperscaler infrastructure spending.
What the gap actually means for builders
For teams shipping AI products, this isn’t an abstract Wall Street debate — it’s a pricing and roadmap signal. A widening capex-to-revenue gap historically precedes one of two things: subsidized compute gets pulled back, or providers push harder on enterprise monetization to close the hole. Either way, cloud GPU economics are the variable to watch. If inference pricing tightens before revenue catches up, margins on AI features built on third-party APIs get squeezed first — well before the infrastructure layer feels it.
Practical read for builders: don’t assume today’s token pricing is stable for the next 18 months. Model your unit economics with a buffer for price normalization, and watch hyperscaler capex guidance the same way you’d watch a supplier’s balance sheet.
Living leaderboards: the other half of the accountability story
Alongside the money numbers, benchmark and litigation-style trackers remain one of the few concrete ways to measure whether AI progress matches the spending. BenchLM’s September LegalBench snapshot has Claude Fable 5 leading the public score table at 88.56%, while a separate Legal Research Bench snapshot shows Claude Opus 5 and Claude Fable 5.1 tied at the top with 55.29%. The gap between those two scores — nearly 33 points on the same underlying model family — is itself a data point worth tracking: general legal benchmarks and applied legal-research benchmarks are not measuring the same thing, and vendors citing “state of the art” without specifying which leaderboard should be treated skeptically.
| Metric | Value | Source |
|---|---|---|
| US data center construction (annualized, July) | $75B+ | Axios |
| Global data-center capex, 2026 forecast | ~$800B | PwC |
| Cumulative AI infra investment through 2050 | $31.6T | PwC |
| Estimated annual AI revenue gap | ~$600B | Market commentary |
| LegalBench leader (Sept snapshot) | Claude Fable 5 — 88.56% | BenchLM |
| Legal Research Bench leaders | Claude Opus 5 / Fable 5.1 — 55.29% (tied) | BenchLM |
The honest counter-argument
None of this proves a bubble. Infrastructure buildouts routinely run ahead of revenue in capital-intensive industries — telecom fiber, cloud computing itself in the early 2010s, and semiconductor fabs all show multi-year lags between capex and monetization. PwC’s $31.6 trillion figure is a 25-year cumulative forecast, not a near-term liability, and hyperscalers are financing much of this build with cash flow from profitable existing businesses, not debt alone. The $600 billion gap estimate also varies significantly depending on which revenue lines (API, enterprise licensing, ad-adjacent AI features) analysts include or exclude — treat it as directional, not precise.
What we’re watching next
- Q4 hyperscaler earnings for explicit AI revenue disclosures versus capex guidance
- Whether U.S. data center construction pace holds above $75B or decelerates
- New leaderboard snapshots from BenchLM and similar trackers, to see if score gaps between legal benchmarks narrow or widen
- Any signs of inference pricing changes tied to margin pressure
This tracker will update as new capex, revenue, and leaderboard data lands — treat the numbers above as a baseline, not a final verdict.